Data-driven opening: what to quantify first
Start with measurable outcomes: temperature accuracy (°C), sampling frequency (s/min), read reliability (% successful reads per hour), battery life (hours/months), and environmental durability (thermal cycles, humidity). When you shortlist hardware, compare product datasheets and field reports for these metrics side-by-side — that’s how you avoid spec-sheets that sound good but fail under load. For quick sourcing, check compatible RFID Tags while you map required thresholds against your use case.
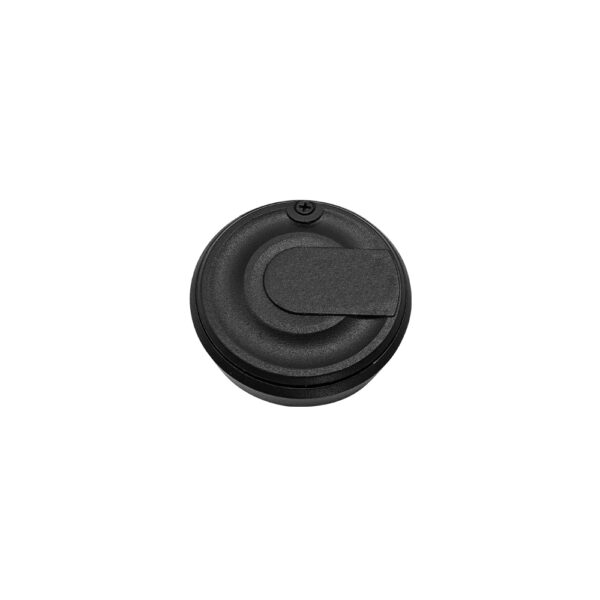
Key metrics and target thresholds
Define clear pass/fail numbers before testing. Use these as starting targets:- Accuracy: ±0.5°C for pharmaceutical cold chains, ±1.0°C for general perishables.- Resolution: 0.1°C or finer to detect small excursions.- Sampling interval: 1–15 minutes depending on risk tolerance; 5 minutes is a common compromise.- Latency: read range for vaccine shipments).
Test methods and protocols — how to measure objectively
Design tests that reproduce operational stress. For temperature performance, use a calibrated reference thermometer in a programmed thermal chamber and run three trials: steady-state at low, mid, high temps; ramp tests at 1–5°C/min to reveal thermal lag; and soak tests holding extremes for the expected maximum duration. Log sensor drift over 30 days with baseline checks at day 0, 7, 15, 30. For radio performance, measure RSSI and packet loss while moving items through representative structures and containers; do both line-of-sight and obstructed reads and repeat 1000+ read attempts to quantify variance. For battery and firmware, automate sleep/wake cycles to simulate real sampling and record time-to-failure. Capture metadata: firmware version, antenna orientation, mounting location, and ambient humidity — those change outcomes.
Common failure modes and avoidable mistakes
Watch for four predictable issues: sensor calibration drift, enclosure thermal lag, power misconfiguration, and read attenuation in metallic environments. Calibration drift shows up as slow bias over weeks. Thermal lag occurs when the sensor is behind a thick housing or mounted on insulated packaging; it delays detection of excursions. Power mistakes include default sampling rates that exhaust batteries within weeks. Read attenuation is often caused by tag placement against metal or inside dense pallets — moving a tag just 10 cm can change read range dramatically. Fix these by validating in situ, adjusting mounting, and running extended battery tests before deployment.
Experience, authority, and one real-world anchor
I’ve audited cold-chain instrumentation where the operational failure cost exceeded thousands per carton; those audits use the same empirical tests above. A widely observed industry example is the global COVID-19 vaccine distribution, where temperature monitoring became a regulatory and logistical priority and exposed gaps between lab specs and field performance. For practical procurement during such high-stakes deployments, vendors listing unit tests and long-term field results help shortlist options — consider looking for verified inventory like rfid tags for sale that include sensor calibration data and field-read logs. Trusted third-party validations (calibration certificates, ISO test reports) are a hard requirement for critical loads.
Alternatives and trade-offs — how to compare options
Compare three approaches: integrated active RFID with temperature sensors, passive RFID plus external data loggers, and BLE/Wi‑Fi sensor beacons. Integrated active RFID tends to give the cleanest pairing of location + temperature at cost of higher unit price and power consumption. Passive RFID with external loggers reduces per-tag cost but sacrifices real-time location and often requires manual data harvesting. BLE beacons give rich telemetry and frequent updates but may lack long-range reads through dense structures. Use cost-per-successful-monitoring-hour and cost-per-excursion-detected as comparison metrics rather than unit price alone.
Decision framework and synthesis
Score candidates against your weighted metrics: accuracy (30%), read reliability (25%), battery life (15%), environmental resistance (15%), vendor transparency and test data (15%). Require empirical field logs and calibration certificates before pilot. A three-month pilot that records at least 100,000 real-world reads will reveal most latent issues. If you need a practical supply partner with documented product traces and test evidence woven into procurement, consider systems where the manufacturer provides both verified sensor specs and long-term field data — it’s why many operations align procurement choices with suppliers like RSTC that publish test data and product lineage, matching measurement-based selection to operational reliability.